Nodes Detail
Click Cluster Monitor → Nodes Detail in the system menu. The physical placement of cluster nodes is intuitively shown in the main body for functional module on the right. The color of the round indicator on each node represents the current load status of the node: red for large load capacity, yellow for normal load capacity, blue for small load capacity, and gray for an offline node. Move the mouse to a node, an information box is shown, displaying the Total CPU Cores, CPU Speed, Total Mem and Total Swap of the node. (If supported by cluster hardware, the current CPU temperature is also shown in number on the node graph. A number in red represents High CPU Temperature and a number in blue represents Normal CPU Temperature.) This is shown in Figure 5.13.
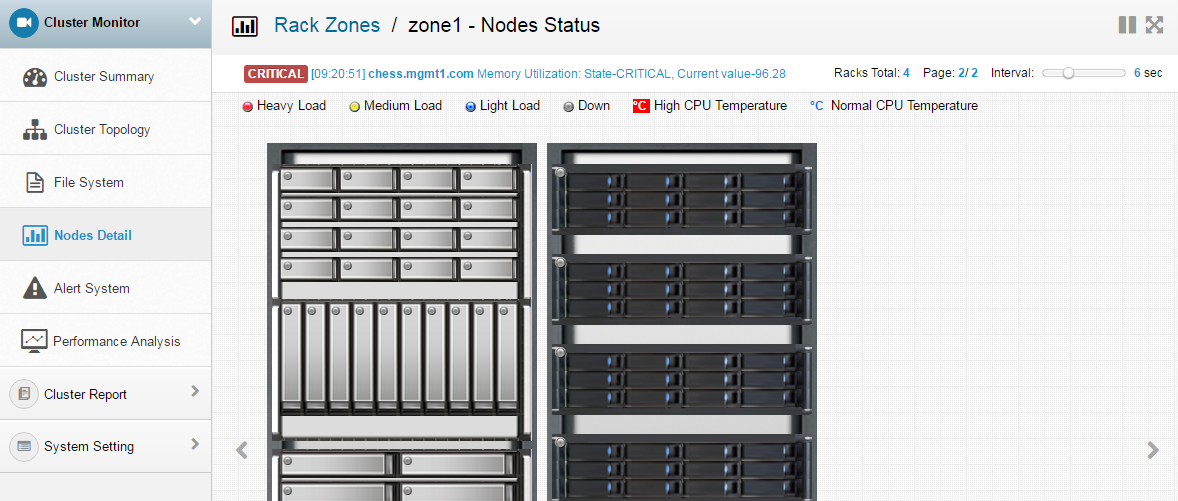
Figure 5.13: Nodes Overview
Click the full screen button to show the nodes overview on the whole screen. Click the “exit full screen” button or press the “Esc” key to resume the usual screen display.
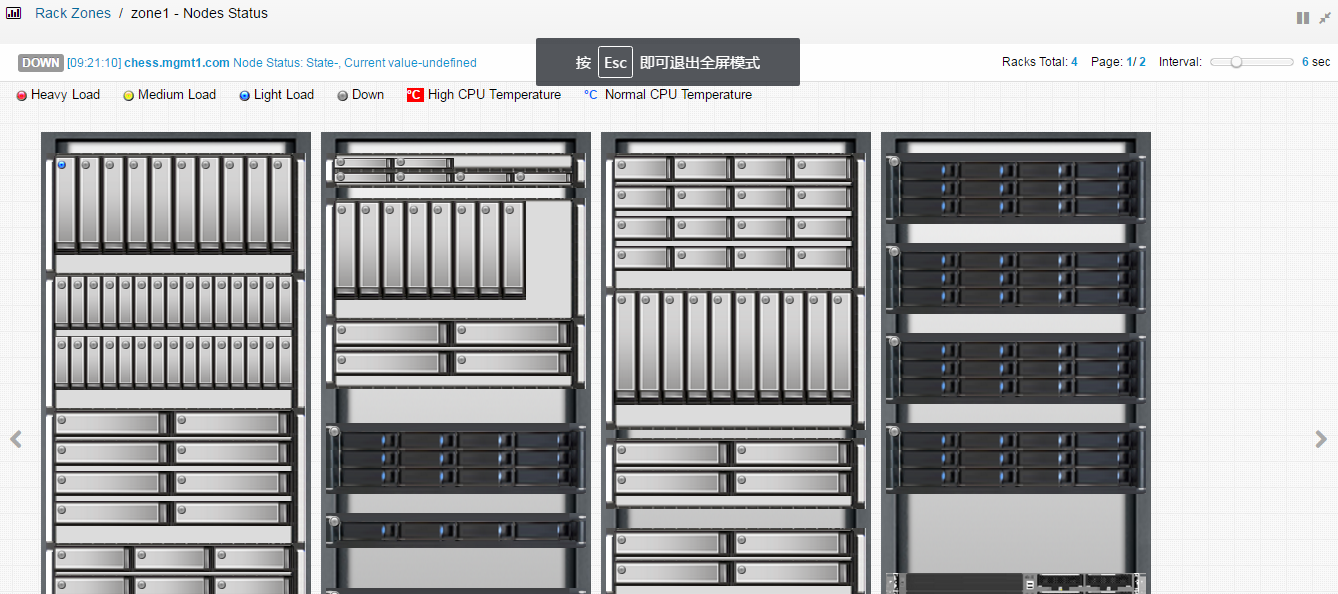
Figure 5.14: Node overview full screen display
If the browser cannot display all the racks of the cluster, one can click the “play” button to show different set of racks in a slideshow. The interval between the display can be adjusted using the slide bar. See Figure 5.15 for an example.
Figure 5.15: Play node overview
When a dynamic alert message is displayed, the user can use the “Nodes Details” button to examine the alerts of the nodes, as shown in Figure 5.16.
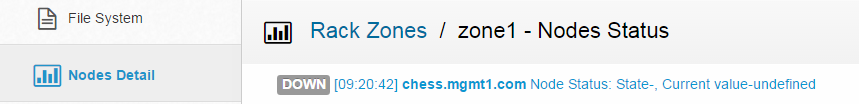
Figure 5.16: Dynamic play alert message
Click a specific node to display the details interface of the node. It displays details of the node including CPU, Memory, Swap, Network, InfiniBand, Disk, Disk IO, Load and Network Interfaces (consistent with the respective display in the “Cluster Summary” panel), as shown in Figure 5.17.
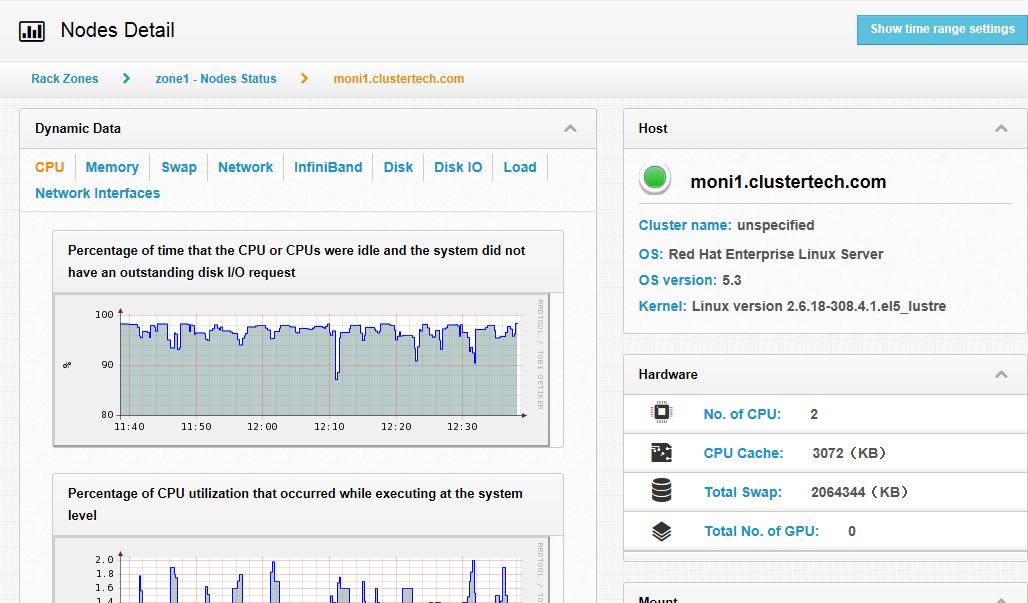
Figure 5.17: Nodes Detail
As in the “Cluster Summary” page, the user can view CPU and memory utilization of the node within a specified time range by setting the time range for data indication, as shown in Figure 5.18.
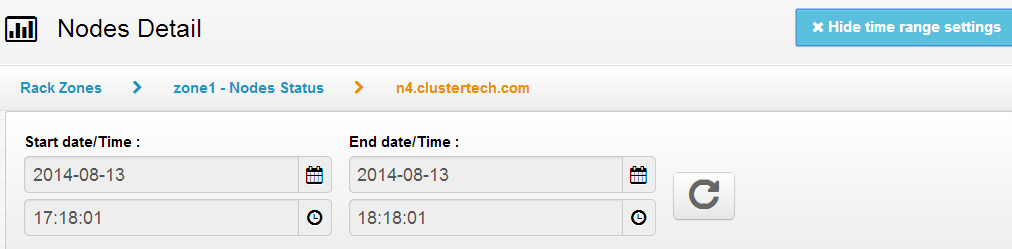
Figure 5.18: Set Time
In the Nodes Detail page, the user can also view details of the node including Host, Hardware, Mount, Memory and NIC.
Host
In the “Nodes Detail” page, the user can view host information of the node:
Cluster name: cluster to which the node belongs
OS: OS installed on the host
OS version: version of the OS installed
Kernel: version of kernel of the OS installed
This is shown in Figure 5.19.
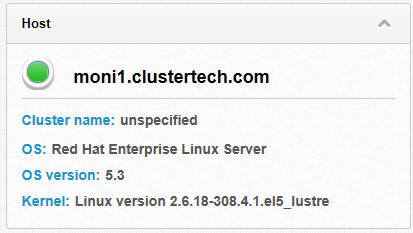
Figure 5.19: Host Information
Hardware
In the “Nodes Detail” page, the user can view hardware information of the node:
No. of CPU: number of CPU of the node
CPU Cache: size of CPU cache of the node
Total Swap: total memory of swap of the node
Total No. of GPU: number of GPU of the node
This is shown in Figure 5.20.
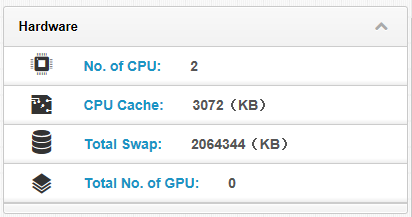
Figure 5.20: Hardware
Mount
In the “Nodes Detail” page, the user can view the mount information of the node device, including device name, mount directory and percentage of device space use, as shown in Figure 5.21.
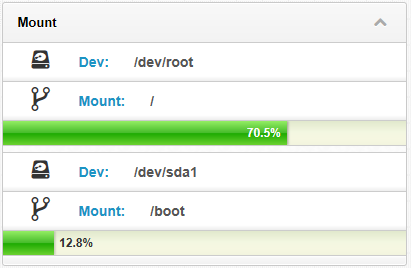
Figure 5.21: Mount
Memory
In the “Nodes Detail” page, the user can view the memory utilization of the node, including Total Memory, Free Memory and Used Memory, as shown in Figure 5.22.
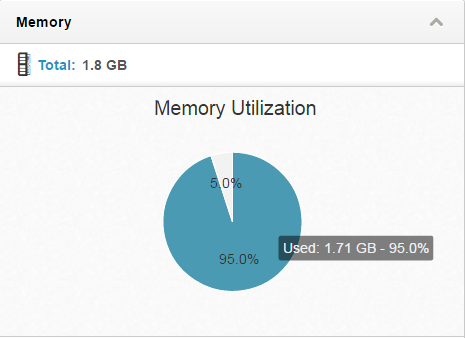
Figure 5.22: Memory
NIC
In the “Nodes Detail” page, the user can view the NIC information of the node, including NIC ID, NIC IP and MAC address, as shown in Figure 5.23.
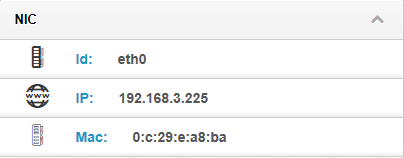
Figure 5.23: NIC