Cluster Monitor
CHESS provides an intuitive server rack diagram that corresponds to the physical arrangement of the servers. One can monitor the various status of the servers, including the loading, online status, CPU temperature, etc.
In case parallel file system, such as Lustre, is used, the CHESS monitor feature also provides its status, including disk space usage, disk space availability, and the file system usage and capacity changes.
CHESS can generate appropriate alerts whenever there is any problem with the nodes or the loading of the CPU/memory is over pre-defined threshold so that the administrator can take actions timely to manage the situation. Moreover, this module allows user to view the alert messages and the various performance of the nodes.
Cluster Summary
Click Cluster Monitor → Cluster Summary in the system menu. The contents of Cluster Summary are shown in the main body for functional module on the right. By default, status of CPU, Memory, Swap, Network, InfiniBand, Disk, Load and Network Interfaces of the cluster within an hour are displayed, as shown in Figure 5.1.
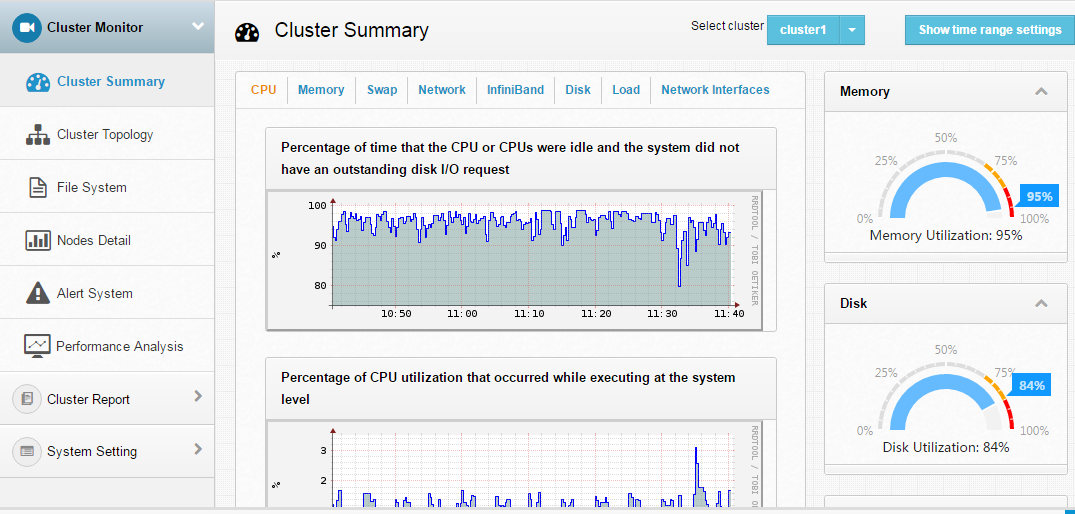
Figure 5.1: Cluster Summary
The user can select to view information by cluster, as shown in Figure 5.2. The setting applies to all cluster management interfaces at the same time.
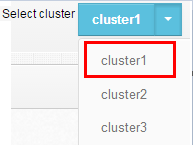
Figure 5.2: Select Cluster
Also, the user can select to view cluster information by time range, as shown in Figure 5.3.
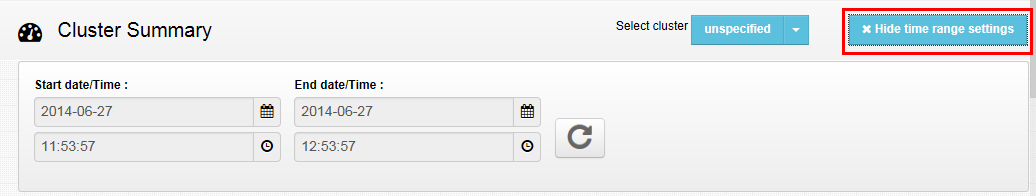
Figure 5.3: Set Time
In addition, in the Cluster Summary interface, the user can monitor cluster information such as Total Memory Utilization, Total Disk Space Utilization, CPUs Total and Online Nodes.
CPU Status Monitor
With the CPU tab under “Cluster Summary”, the user can monitor CPU status of the cluster, including:
Idle CPU percentage: percentage of idle CPU in total CPU of the cluster
CPU utilization at the system level: percentage of kernel space in total CPU of the cluster
CPU Utilization at the user level: percentage of user space in total CPU of the cluster shown in the figure 5.4
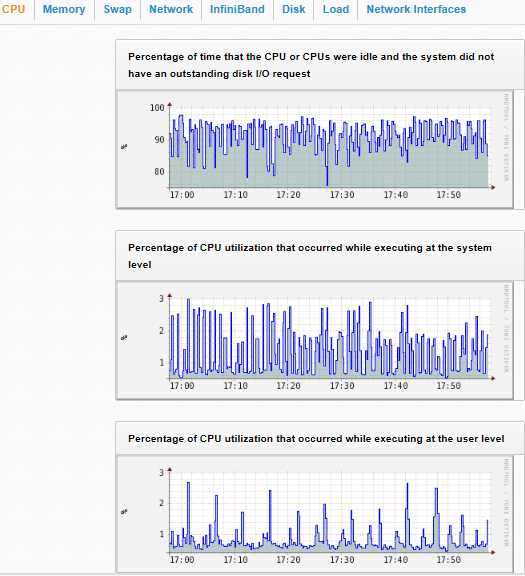
Figure 5.4: CPU Monitor
Memory Status Monitor
With the Memory tab under “Cluster Summary”, the user can monitor memory status of the cluster, including: Total Memory: total memory of the
Memory Free: total memory free of the cluster
Memory Buffered: total memory buffered of the cluster. Buffer refers to memory temporarily used by CPU to access I/O devices. Since Linux uses the cache to store file content, the memory here is mainly only for file metadata like directory structure and file attributes. Typically the amount of memory used is a few hundred MB.
Memory Cached: total memory cached of the cluster Cache refes to the memory that the CPU used to keep file data. It is kept in memory to reduce the need to access files in I/O devices. Usually, most of the memory not used by application or buffer is allocated to cache to improve performance. Only a small amount is completely left unused.
This is shown in Figure 5.5.
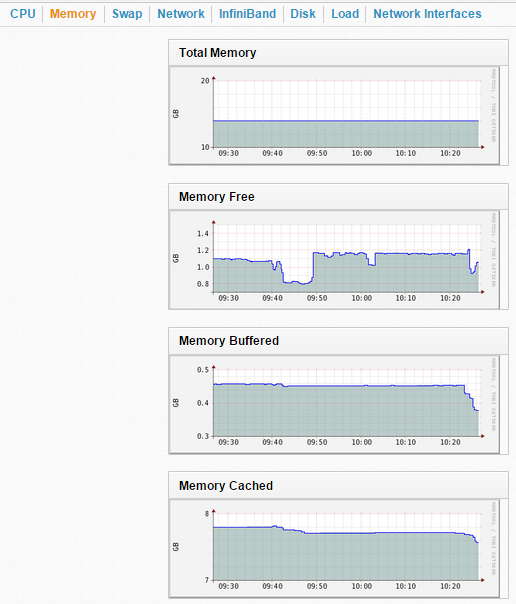
Figure 5.5: Memory Monitor
Swap Status Monitor
With the Swap tab under “Cluster Summary”, the user can monitor swap status of the cluster, including Total Swap and Used Swap, as shown in Figure 5.6.
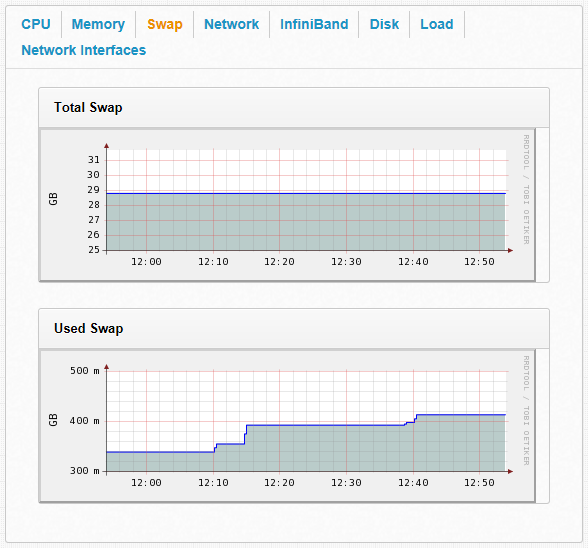
Figure 5.6: Swap Monitor
Network Traffic Monitor
With the Network tab under “Cluster Summary”, the user can monitor network status of the cluster, including:
Number of Bytes IN: Number of Bytes IN last hour
Number of Bytes OUT: Number of Bytes OUT last hour
Number of Packets IN: Number of Packets IN last hour
Number of Packets OUT: Number of Packets OUT last hour
Infiniband Traffic Monitor
When an Infiniband device is available in the user cluster, the user can monitor Infiniband status of the cluster with the Infiniband tab under “Cluster Summary”. It includes:
Number of Bytes IN: Number of Bytes IN last
Number of Bytes OUT: Number of Bytes OUT last hour
Number of Packets IN: Number of Packets IN last hour
Number of Packets OUT: Number of Packets OUT last hour
Disk Capacity Monitor
With the Disk tab under “Cluster Summary”, the user can monitor disk status of the cluster, including: Disks Idle, Disks Total
Load Monitor
With the Load tab under “Cluster Summary”, the user can monitor load status of the cluster, including: 15 minutes Load Average, 5 minutes Load Average and 1 minute Load Average.
Network Interfaces Monitor
With the Network Interfaces tab under “Cluster Summary”, the user can monitor NIC (Network Interface Card) status of the cluster, including: Number of Bytes IN, Number of Packets IN, Number of Bytes OUT and Number of Packets OUT.