CHESS Job Report
CHESS Job Report shows the summary and details of reports through charts and tables respec- tively. The category includes the following specific reports.
CHESS Done Jobs Report
To view the report, click Cluster Report → Report in the system menu, then select “CHESS Done Jobs Report” from the drop-down menu of “Report Type” in the “Report Option” panel, as shown in Figure 6.4.
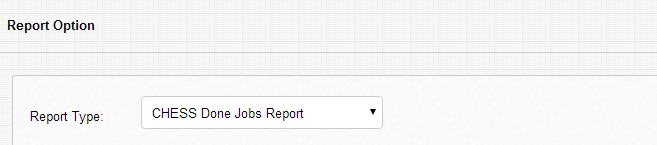
Figure 6.4: Select CHESS Done Jobs Report
Set Statistics Time
Select “Month”, “Day” or “Hour” as the granularity of statistics under “Time Option” in the “Report Option” panel, as shown in Figure 6.5. The period of time displayed can also be selected.
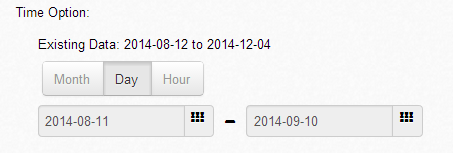
Figure 6.5: Set Statistics Time
Set User Option
Select producing statistics for “Queue” under “User Option” in the “Report Option” panel as shown in Figure 6.6.

Figure 6.6: Set User Option
Select Resource Attribute
Select the statistics displayed, one of“Number of Done Jobs”, “Core-Hour” or “Walltime”, under “Resource Attribute” in the “Report Option” panel, as shown in Figure 6.7.
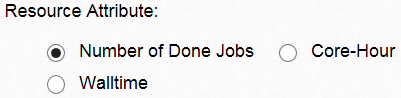
Figure 6.7: Select Resource Attribute
- “Number of Done Jobs” means the number of done jobs within the selected time range.
- “Core-Hour” means the CPU Core-hour of done jobs within the selected time range.
- “Walltime” means the actual running time of done jobs within the selected time range.
Select Chart Style
Select “Charts base on user or user group” or “Charts base on queue” under “Chart Style” in the “Report Option” panel, as shown in Figure 6.8. This affects how the report is broken into pages.
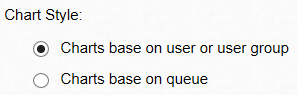
Figure 6.8: Select Chart Style
Click “View Report” to display the report in the Report panel, as shown in Figure 6.9 and Figure 6.10.
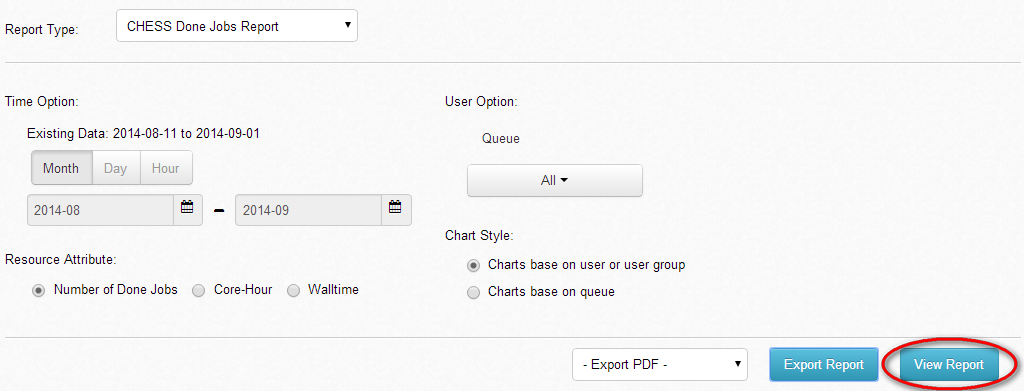
Figure 6.9: Click View Report
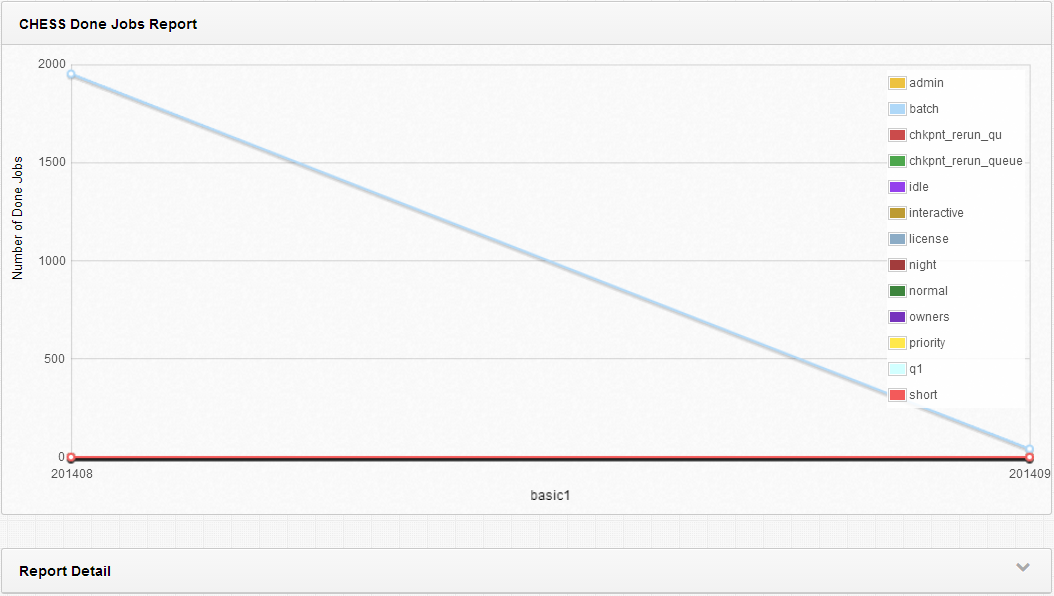
Figure 6.10: Display Report
In the Report panel, the system shows only the chart of the report by default. To view the report details, click the unfold icon in the Report Detail panel as shown in Figure 6.11.
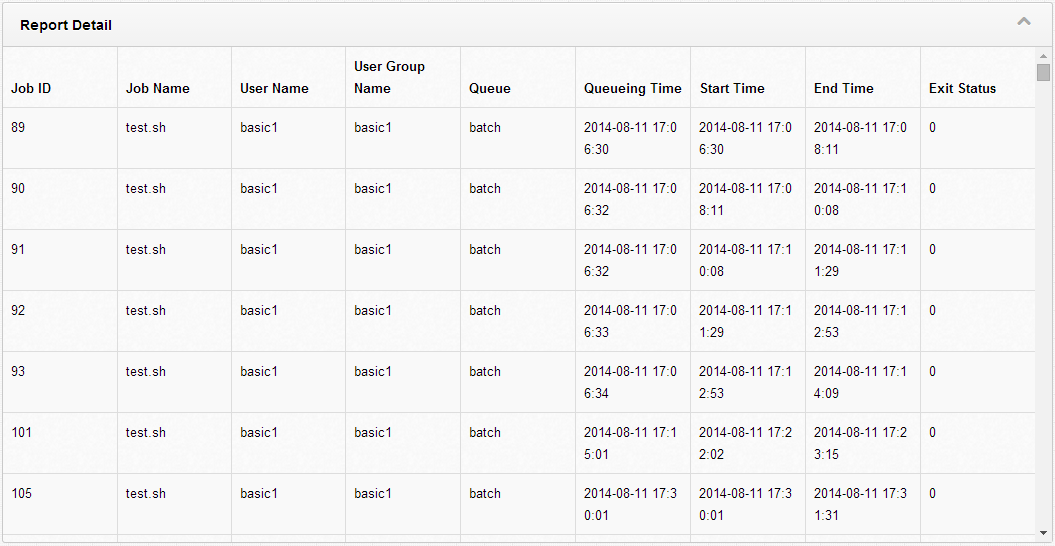
Figure 6.11: Report Detail
The system applies page break on the displayed report according to the “Chart Style” option selected. Since Queue is the only User Option for a non-administrator user (the option User is not available), if user selects “Charts base on user or user group” as the Chart Style, the report is displayed in a single page. If user selects “Charts base on queue”, then page breaks are applied to the displayed report, and each page contains the corresponding information of one of the selected queues. Users can click “First”, “Last”, “Previous” and “Next” to view the other pages of the displayed report, as shown in Figure 6.12.

Figure 6.12: Page Break
Export Report
To export a report, select the export report type from the drop-down menu on the left of the “Export Report” button. There are three export report types available: “Export PDF”, “Export HTML” or “Export Excel”. For example, Figure 6.13, Figure 6.14 and Figure 6.15 shows the effect of HTML export.
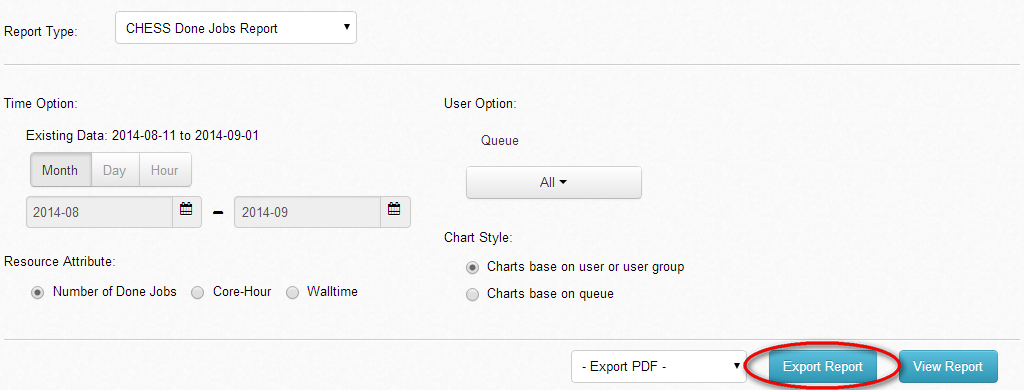
Figure 6.13: Click Export Report
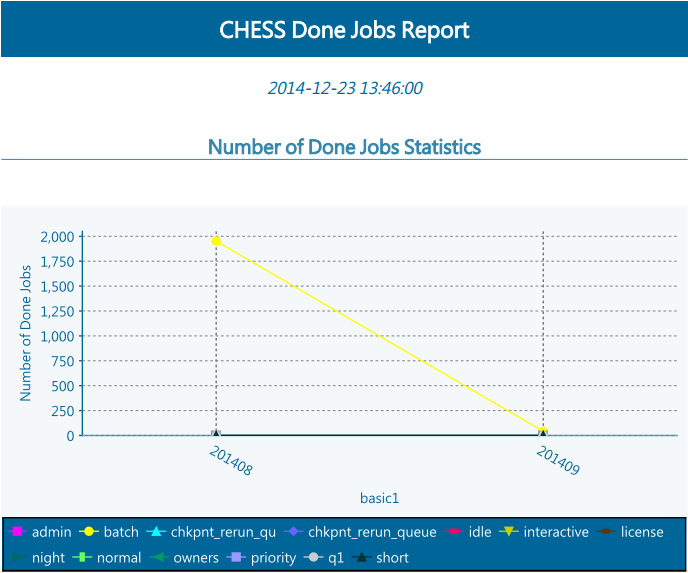
Figure 6.14: Export HTML Report
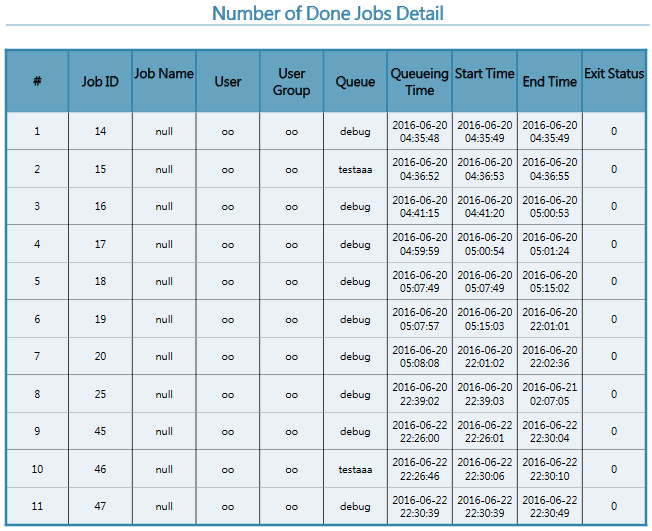
Figure 6.15: Report Detail
CHESS Queueing Jobs Report
To generate a queueing jobs report, click Cluster Report → Report in the system menu, and select “CHESS Queueing Jobs Report” from the drop-down menu of “Report Type” in the “Report Option” panel, as shown in Figure 6.16.
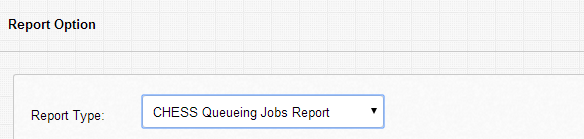
Figure 6.16: Select CHESS Queueing Jobs Report
Except that there are only “Queue”, “Resource Attribute” and “Chart Style” under “User Option”, all other operations are the same as those of “CHESS Done Jobs Report”. Page breaks are applied to the displayed report according to the selection of Queue under User Option. Each page displays the corresponding report information of one of the selected queues only.
CHESS Running Jobs Report
To generate a running jobs report, click Cluster Report → Report in the system menu, and select “CHESS Running Jobs Report” from the drop-down menu of “Report Type” in the “Report Option” panel, as shown in Figure 6.17.
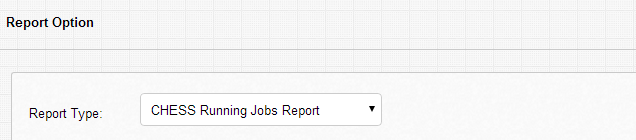
Figure 6.17: Select CHESS Running Jobs Report
Except the unavailability of “Resource Attribute”, other operations are the same as those of “CHESS Done Jobs Report”. When showing or exporting report, the report includes jobs of the user himself/herself only.
Job Analysis Report
To generate a job analysis report, click Cluster Report → Report in the system menu, and select “Job Analysis Report” from the drop-down menu of “Report Type” in the “Report Option” panel, as shown in Figure 6.18.
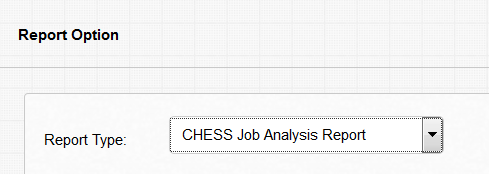
Figure 6.18: Select Job Analysis Report
Job Analysis Report requires time selection only. The steps of time selection are the same as those for CHESS Done Jobs Report.
Display Report
Click “View Report”. The system displays the report in the Report panel, as shown in Figure 6.19 and Figure 6.20.
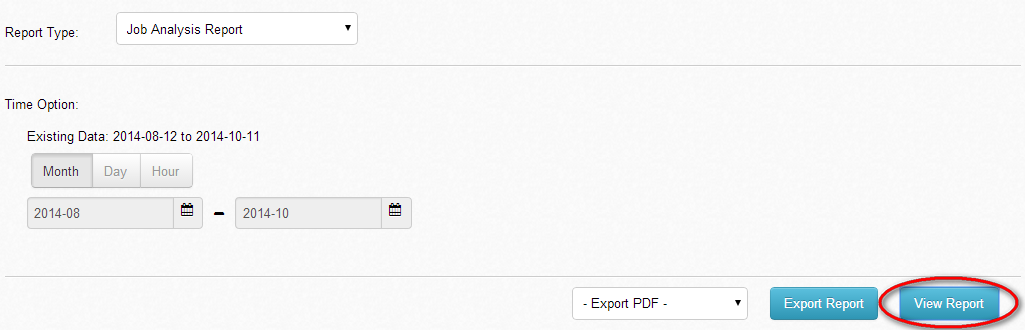
Figure 6.19: Click View Report
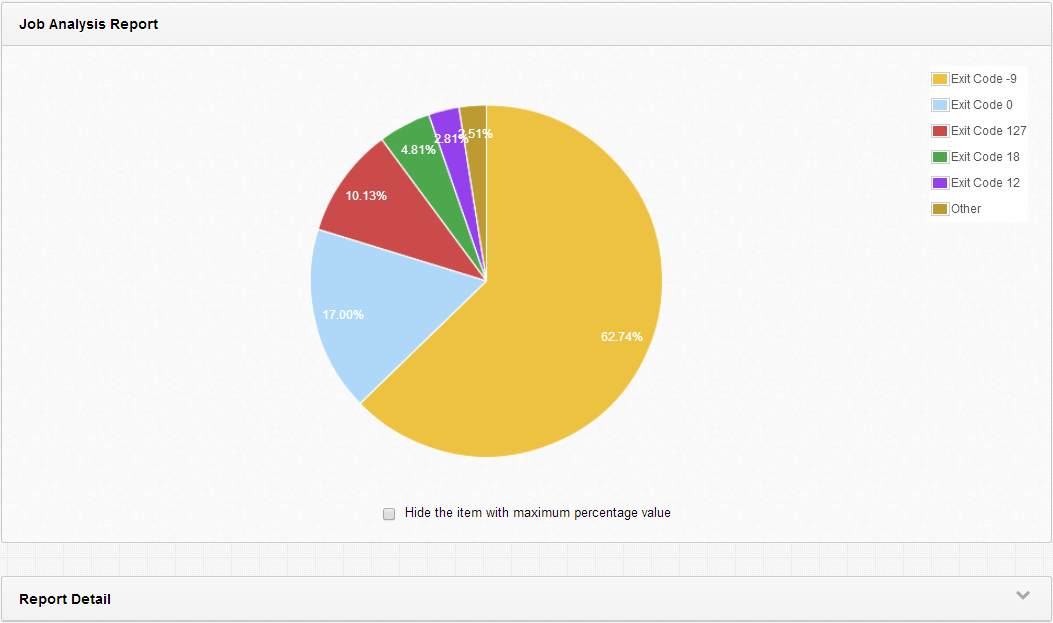
Figure 6.20: View Report
In the Report panel shown above, if “Hide the item with maximum percentage value” is checked, then the pie chart of Job Analysis Report shows the percentage of all exit codes except the one with the largest percentage. The system by default shows the chart of the report only. Click the unfold icon in the Report Detail panel to view report details, as shown in Figure 6.21.
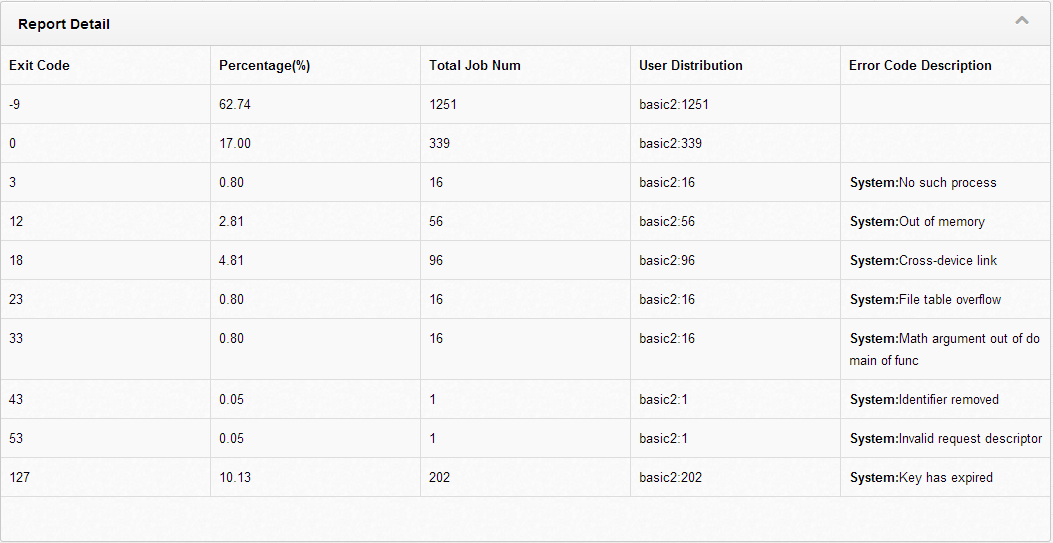
Figure 6.21: Report Detail
Job Analysis Report is shown in a single page.
Export Report
Select the export report type from the drop-down menu on the left of the “Export Report” button. There are three export report types available: “Export PDF”, “Export HTML” or “Export Excel”. Figure 6.22, Figure 6.23, and Figure 6.24 show the result of PDF export.
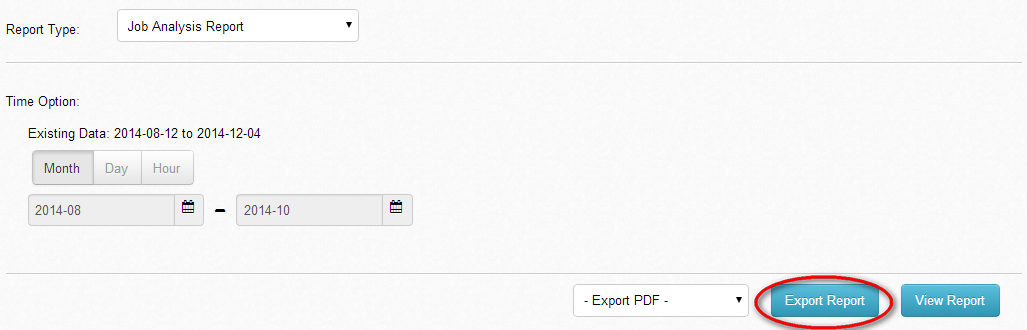
Figure 6.22: Click Export
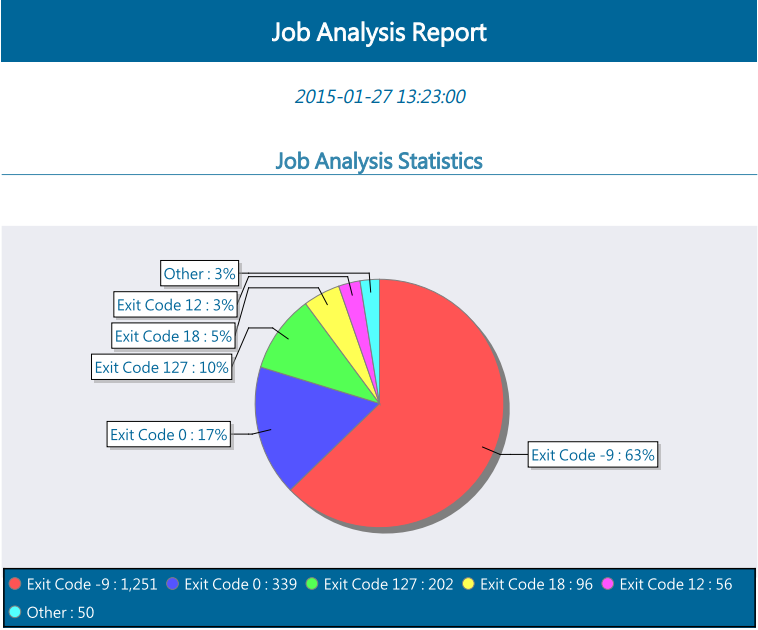
Figure 6.23: PDF Job Analysis Report
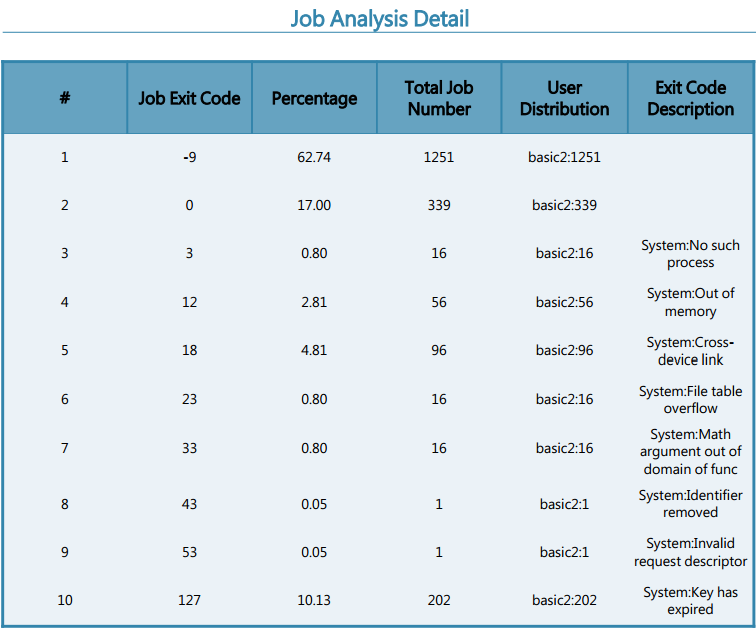
Figure 6.24: PDF Job Analysis Report Detail