Appmon
Click Cluster Monitor → Appmon in the system menu. The performance parameter comparison of all nodes in the cluster is shown in the main body for functional module on the right, as shown in Figure 5.26.
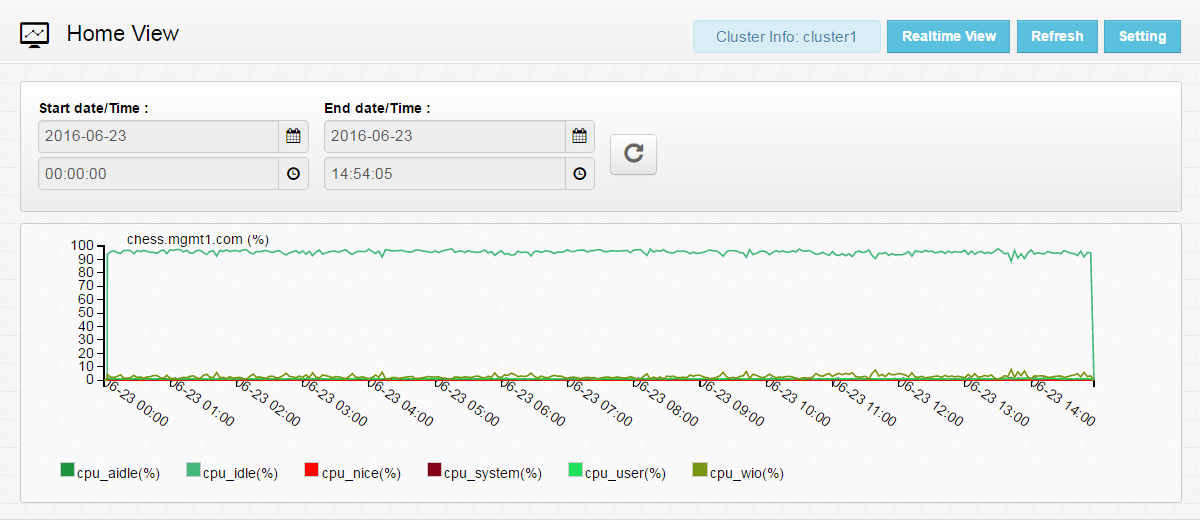
Figure 5.26: Appmon
The user can change the time setting to view performance parameter comparison of all nodes in a specified time range. The user can also select to zoom in a specific time range in the run chart for more accurate comparison. Move the mouse to the performance parameter run chart of a node. A cross-shaped select icon is shown. Press the left mouse button at the start point of the desired time range and drag the mouse, as shown in Figure 5.27. A time range is then selected. Release the mouse at the end point of the desired time range. The run chart shows the performance parameters within the time range in a more detailed manner.
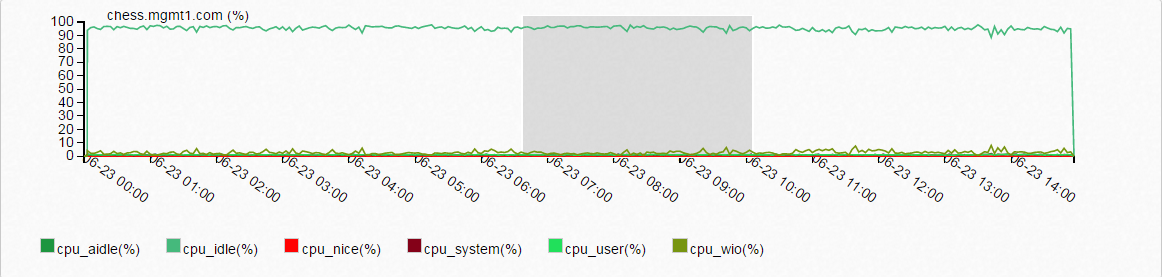
Figure 5.27: Performance Parameter Running Status
Click the “Refresh” icon at the upper right corner of the run chart. All run charts indicating node performance parameters return to the original time range. This is shown in Figure 5.28.
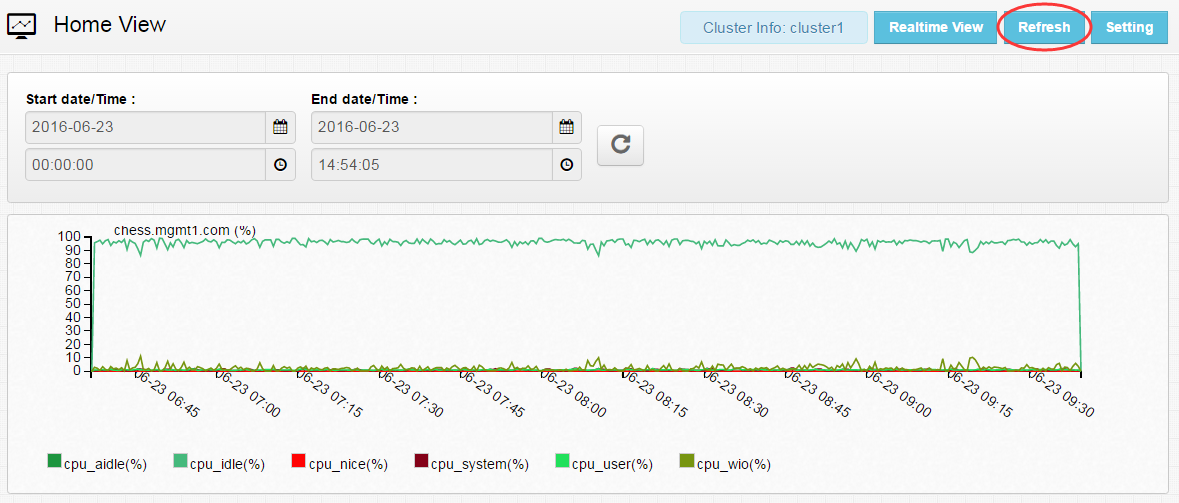
Figure 5.28: Resume
Appmon Overview
In the main interface of Appmon, click “Overview” to enter the Appmon Overview interface. The interface displays changes in the last 150 seconds of monitored performance parameters of all monitored nodes, as shown in Figure 5.29.
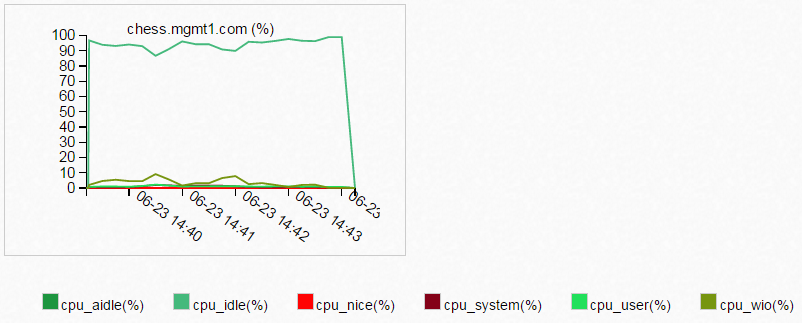
Figure 5.29: Appmon Overview