Cluster Topology
Click “Cluster Topology” under “Cluster Monitor” to show the topology of the cluster, representing the connectivity of the set of switches. It also shows the name, IP and state of each network switch. When a network switch is online, its icon is blue in color; otherwise, it is gray. See Figure 5.7 for an example.

Figure 5.7: Cluster Topology
Click a network switch to turn to the details page of the network switch, showing the list of ports of the network switch, the state of each port, and the traffic pattern of each port. The port traffic pattern does not automatically load. The user needs to select a specific port. The ports of the network switch are represented by small boxes. The figure marked on each small box is the number of the port. A gray box represents a disabled port, a green box represents an in-use port, and a green box with orange frame represents a currently selected port. This is shown in Figure 5.8.
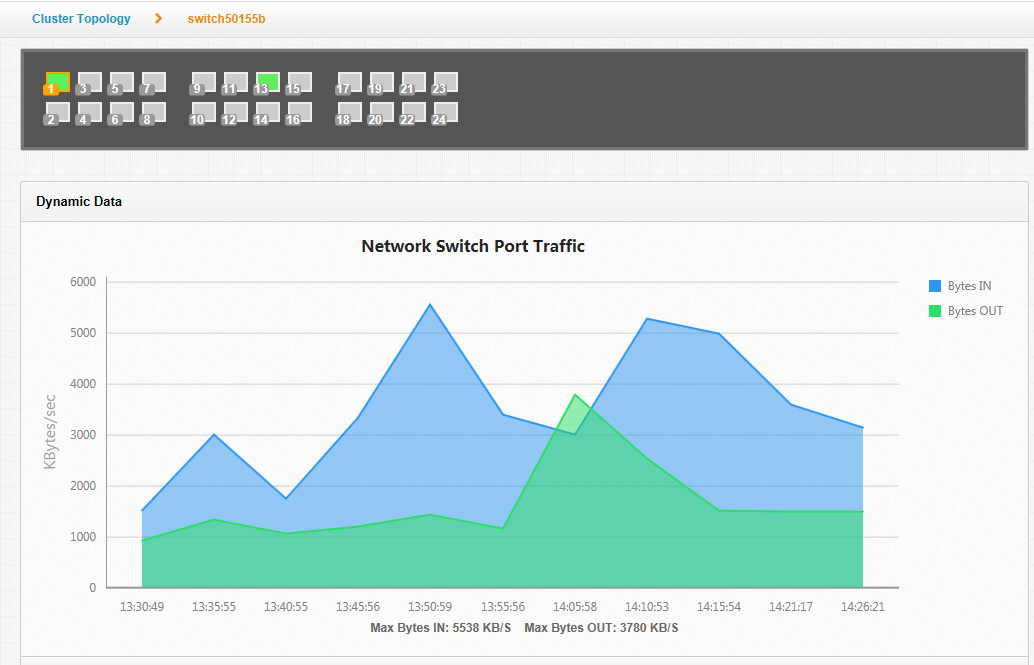
Figure 5.8: Network Switch
The user can view the traffic of a network switch port within a specified time range by setting the start time and the end time. Upon completion of time setting, click the “Refresh” icon to update the traffic pattern, as shown in Figure 5.9.
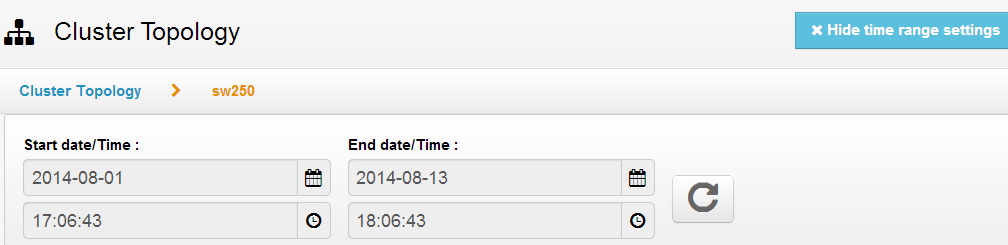
Figure 5.9: Set Time