Alert System
Click Cluster Monitor → Alert System in the system menu. Abnormal information in the cluster is shown in the main body for functional module on the right. The user can select to view alert information within a specified time range as needed. Filtering of alerts by Host, Alert Type and State is supported. Also, deletion of a single alert or all alerts is supported, as shown in Figure 5.24.
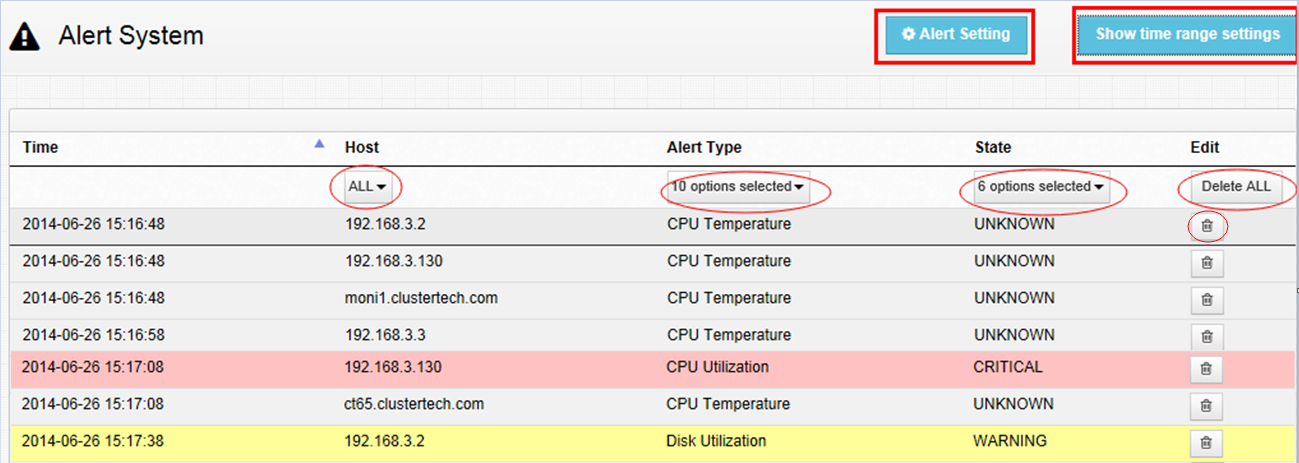
Figure 5.24: Alert System
Alert Setting
In the alert information list page, click “Alert Setting” to view the triggers for cluster alert: CPU Temperature, CPU Utilization , Memory Utilization, Disk Utilization, 1 min/5 mins/15 mins Load Average, and Received/Sent Bytes. There are two alert levels for each: Warning and Critical. Alert values and the Enabled and Submit buttons are in the not editable state and cannot be edited by a normal user, as shown in Figure 5.25.
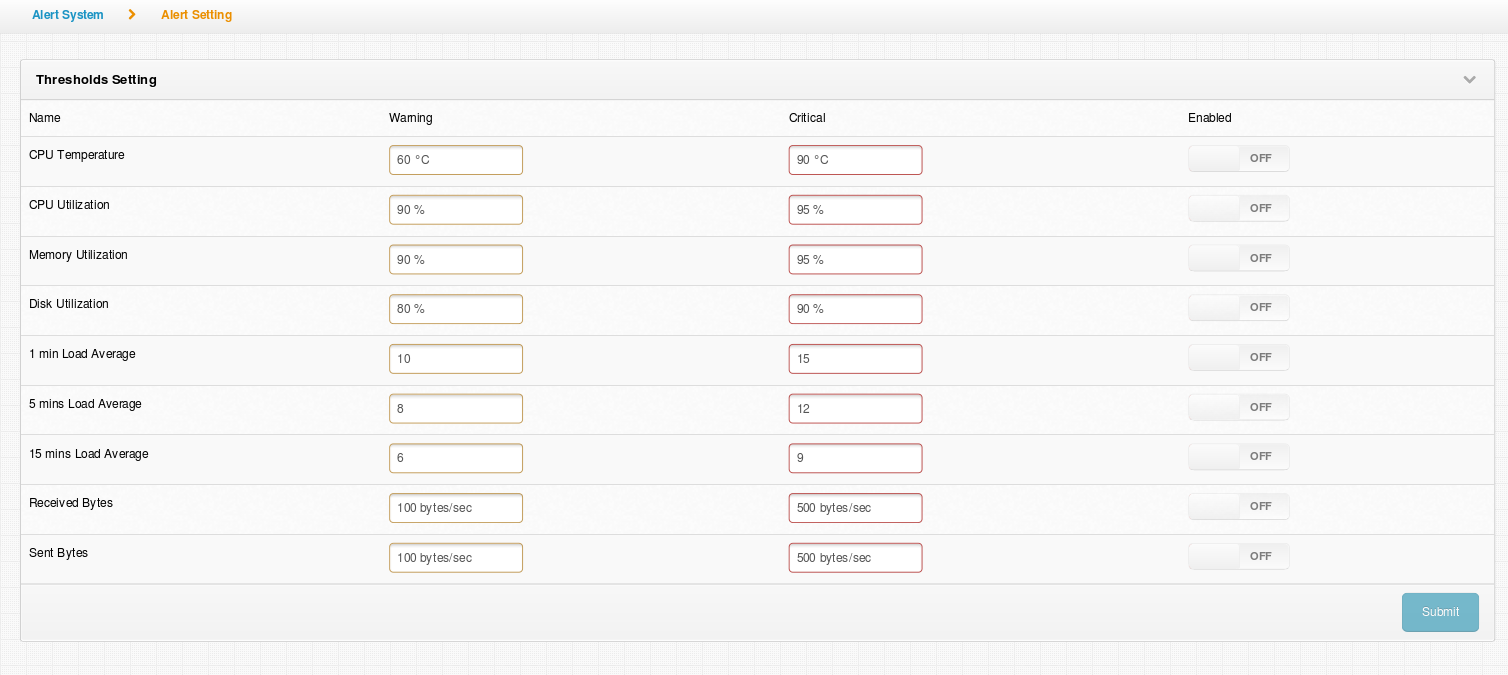
Figure 5.25: Alert Setting
Details of alert thresholds are as follows:
CPU Temperature: CPU temperature of the node, requiring hardware support
CPU Utilization: CPU utilization of the node
Memory Utilization: memory space utilization of the node
Disk Utilization: disk space utilization of the node
17 minutes Load Average: average load in 15 minutes of the node
5 minutes Load Average: average load in 5 minutes of the node
1 minutes Load Average: average load in 1 minute of the node
Received Bytes: number of bytes received by the node on a real-time basis
Sent Bytes: number of bytes received by the node